My last post about the speed of Django’s templating language caused a bit of a stir and it was clear that people didn’t really have a clue how long the templates were taking to render in their applications.
Enter Template-timings
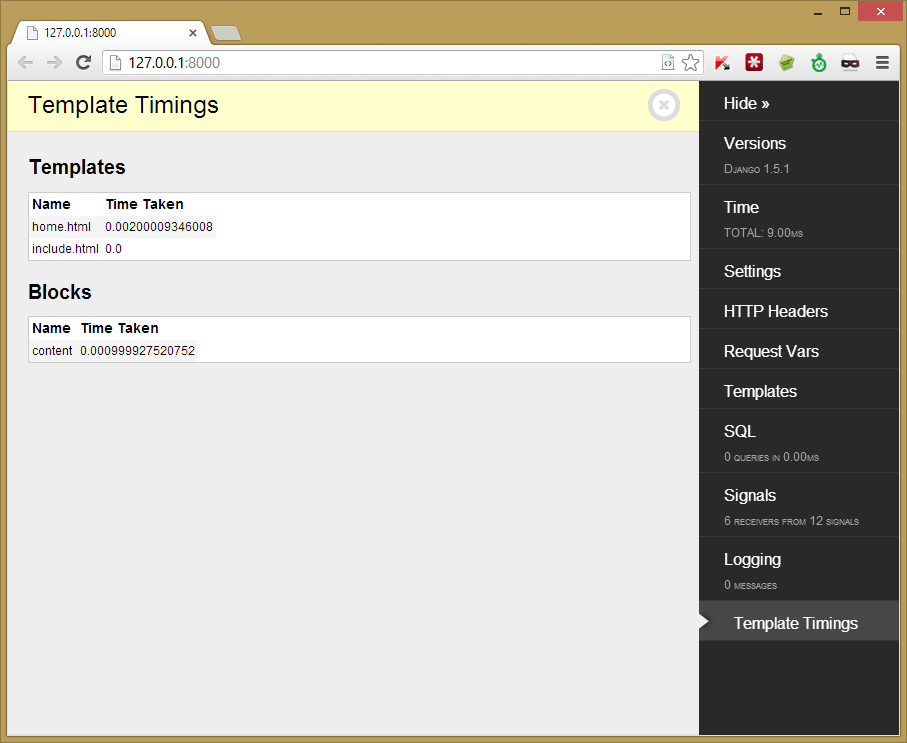
Template-timings is a panel for Django-debug-toolbar (which everyone should be using, right?) that lets you see a breakdown of the rendering process. It currently gives you timing information on each block and template rendered in a convenient panel. It works on {% blocks %}, {% extends %} and {% include %}’ed templates.
Download
Check out the GitHub Repo for installation instructions
How does this work?
Its quite simple. This function replaces Template.render and BlockNode.render. It simply records how long the real render function takes.
Django’s template rendering code is somewhat complex, and this is the best solution I could find. Its not perfect - there doesn’t seem to be a way to tell what block belongs to what template for example, but it works.